![]() Figure 8 of
Trevithick-Sutton, Mol Vis 2006;
12:1127-1135.
Figure 8 of
Trevithick-Sutton, Mol Vis 2006;
12:1127-1135.
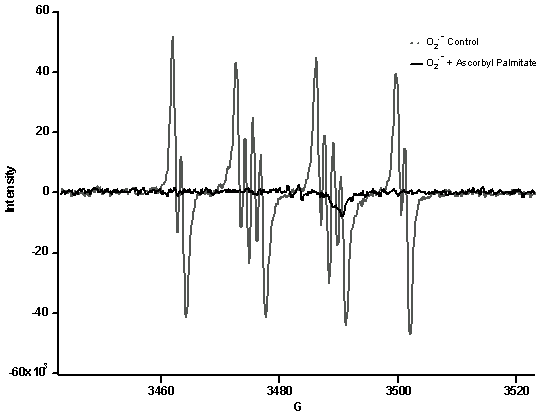
Figure 8.
ESR spectra of DMPO-O2- with and without ascorbyl palmitate. The control cell contained 0.28 ml of 0.5 mM hypoxanthine (in water), 3 μl DMPO, 0.3 ml phosphate buffered saline (PBS), 0.3 ml milliQ water, and 1.2 ml DMSO (total mixture volume of 2.1 ml). The contents of the superoxide and ascorbyl palmitate cell were identical to the control cell, except for the presence of 1.4x10⁻⁴ M ascorbyl palmitate. To each vial, 0.02 ml of xanthine oxidase (0.1 dilution from 25 units per 0.8 ml) was added immediately prior to pumping into the flow cell in the ESR chamber and the spectra were collected approximately 1 min later.