![]() Figure 5 of
Trevithick-Sutton, Mol Vis 2006;
12:1127-1135.
Figure 5 of
Trevithick-Sutton, Mol Vis 2006;
12:1127-1135.
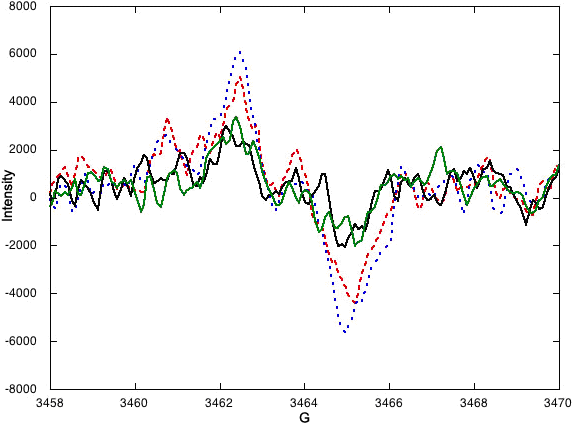
Figure 5.
ESR spectra of DMPO-OH with and without 1.4x10⁻⁴ M lutein. Data were collected at 1 min (when solution reached the ESR chamber flow cell) and at 5 min after the addition of hydrogen peroxide. Lines shown are ESR spectra of controls at 1 min (red dots) and 5 min (blue dots), and with lutein after 1 min (black solid line) and 5 min (green solid line). After five min, more DMPO-OH is present in the control, and in the presence of lutein.
