![]() Figure 3 of
Trevithick-Sutton, Mol Vis 2006;
12:1127-1135.
Figure 3 of
Trevithick-Sutton, Mol Vis 2006;
12:1127-1135.
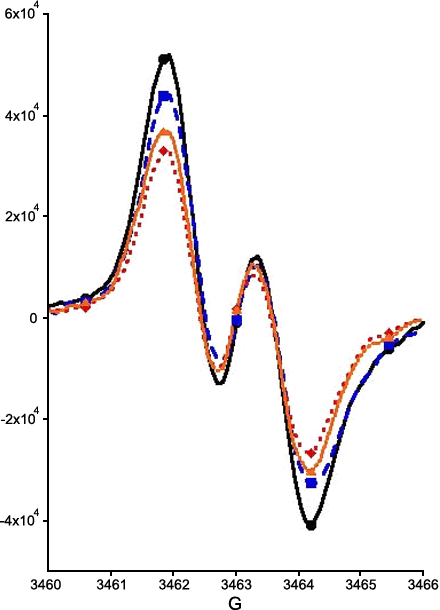
Figure 3.
A section of ESR spectra of DMPO-OB2PB-P with and without 1.4x10¹⁴ M zeaxanthin. Data were collected at 1 min (when solution reached the ESR chamber flow cell; black line, control and red line with zeaxanthin) and at 5 min (blue line control and orange line with zeaxanthin) after the addition of xanthine oxidase. This axis expansion shows that given time, less DMPO-O2- is present in the control, but more DMPO-O2- is produced in the presence of zeaxanthin. ESR parameters were as described in the methods section.
