![]() Figure 9 of
Chudgar, Mol Vis 2006;
12:1117-1126.
Figure 9 of
Chudgar, Mol Vis 2006;
12:1117-1126.
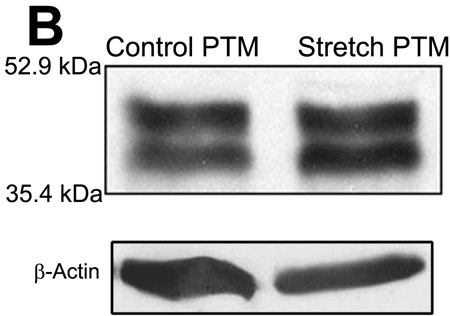
Figure 9.
Stretch-induced effects on CTGF levels in porcine TM cells. A: Graph showing mean densitometric readings (n=4) of immunoblots for CTGF expression in porcine TM cells. Expression in control cells and cells exposed to 15% mechanical stretch for 15 h is shown. A mean increase of 13.4% was seen (p<0.009) in CTGF levels in mechanically stretched TM cells. B: A representative western blot of CTGF obtained from the stretch experiment is provided in this figure. In addition to using equal amount of proteins in the immunoblot analysis, the blots were immunoblotted for β-actin to confirm the loading equivalence in protein between the control and treated samples.