![]() Figure 8 of
Chudgar, Mol Vis 2006;
12:1117-1126.
Figure 8 of
Chudgar, Mol Vis 2006;
12:1117-1126.
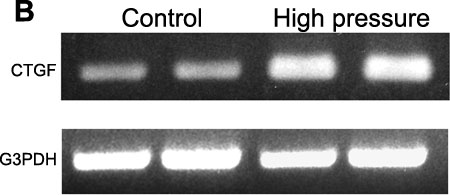
Figure 8.
Changes in CTGF expression in porcine TM tissue exposed to increased ocular pressure. A: Graph showing mean densitometric readings (n=4) of RT-PCR amplification for CTGF expression in porcine TM tissue after perfusion at control (15 mm Hg) and high pressure (50 mm Hg) for 5 h. A mean increase of 20% was seen (p<0.009) in CTGF expression in TM tissue subjected to high pressure. B: A representative Polaroid photograph of RT-PCR results is shown in this figure. C: G3PDH was amplified to serve as an internal control, using the same samples as in A.