![]() Figure 7 of
Chudgar, Mol Vis 2006;
12:1117-1126.
Figure 7 of
Chudgar, Mol Vis 2006;
12:1117-1126.
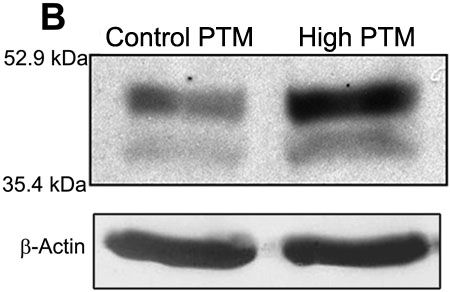
Figure 7.
Induction of CTGF in porcine TM tissue under increased ocular pressure. A: Graph showing mean densitometric readings (n=4) of immunoblots for CTGF expression in porcine trabecular meshwork tissue after perfusion at control (15 mm Hg) and high pressure (50 mm Hg) for 5 h. A mean increase of 50.3% was seen (p<0.014) in TM tissue obtained from eyes perfused under high pressure (50 mm Hg). B: A representative CTGF western blot of lysates derived from TM tissue samples of eyes perfused under control and high pressure are shown here. Equal amounts of protein from control and high pressure samples were used for the immunoblot analysis. Additionally, blots were immunoblotted for β-actin to confirm the loading equivalence in protein between the control and treated samples.