![]() Figure 4 of
Chudgar, Mol Vis 2006;
12:1117-1126.
Figure 4 of
Chudgar, Mol Vis 2006;
12:1117-1126.
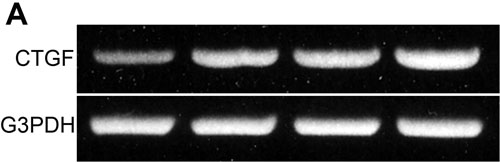
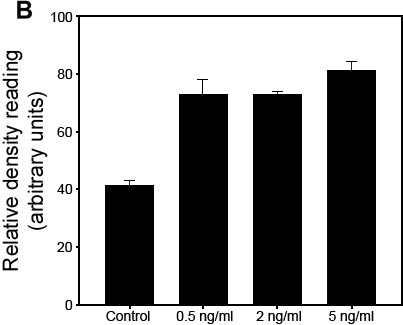
Figure 4.
Dose response of TGF-β1-induced CTGF expression in HTM cells. A: PCR reaction showing dose response induction of CTGF expression by TGF-β1 in serum starved HTM cells. Glyceraldehyde 3-phosphate dehydrogenase (G3PDH) was probed as an internal control in the same RT libraries. B: Graph of relative densitometric readings for data shown in A. A dose-dependent increase in CTGF expression is evident in HTM cells treated with TGF-β1 ranging from 0.5 to 5 ng/ml. Mean values of two independent experiments were presented in B.