![]() Figure 3 of
Chudgar, Mol Vis 2006;
12:1117-1126.
Figure 3 of
Chudgar, Mol Vis 2006;
12:1117-1126.
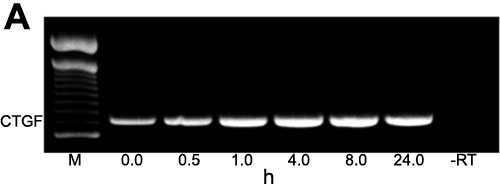
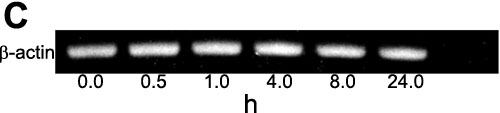
Figure 3.
Time course of TGF-β1-induced effects on the expression of CTGF in HTM cells. A: PCR reaction showing CTGF expression in serum-starved HTM cells treated with TGF-β1 for the indicated time intervals. B: Graph of relative densitometric readings for data shown in A. A time-dependent increase in CTGF expression is evident in HTM cells treated with TGF-β1. C: β-actin was amplified as an internal control, using the same RT libraries described in A.