![]() Figure 2 of
Chudgar, Mol Vis 2006;
12:1117-1126.
Figure 2 of
Chudgar, Mol Vis 2006;
12:1117-1126.
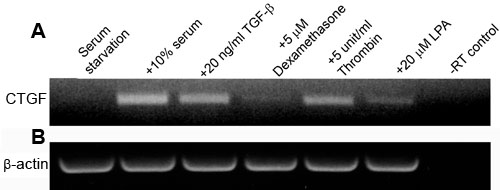
Figure 2.
Induction of CTGF expression in HTM cells treated with various physiological agonists. A: RT-PCR results for CTGF expression after treatment of HTM cells with various physiological agonists for a period of 4 h. B: β-actin was amplified as an internal control, using the same RT libraries described in A. C: Relative densitometric readings based on two independent experiments are shown in the bar graph.