![]() Figure 10 of
Chudgar, Mol Vis 2006;
12:1117-1126.
Figure 10 of
Chudgar, Mol Vis 2006;
12:1117-1126.
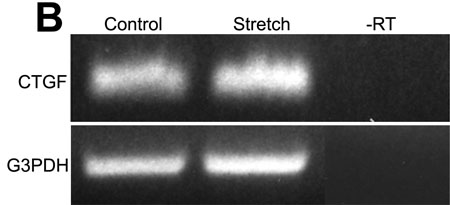
Figure 10.
Stretch-induced effects on CTGF expression in porcine TM cells. A: Graph showing mean densitometric readings (n=4) of PCR amplications for CTGF expression in porcine TM cells. Expression in control cells and cells exposed to 15% mechanical stretch for 15 h is shown. A mean increase of 18.2% was seen (p<0.09). B: A representative Polaroid photograph of PCR-amplified CTGF DNA is shown here.