![]() Figure 6 of
Takada, Mol Vis 2006;
12:1108-1116.
Figure 6 of
Takada, Mol Vis 2006;
12:1108-1116.
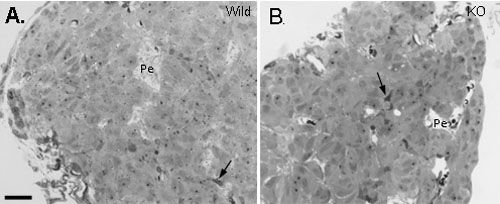
Figure 6. Morphology of WT and RS1-/Y mouse pineal
Epon embedded survey sections 2 μm thick of the pineal gland of WT mouse (A) and the RS-KO mouse (B). Pineal parenchyma is seen separated by connective tissue spaces with blood vessels and perivascular spaces (Pe). The darker stained interstitial cells (arrows) are seen between the pinealocytes. The scale bar represents 25 μm.