![]() Figure 8 of
Andrieu-Soler, Mol Vis 2006;
12:1098-1107.
Figure 8 of
Andrieu-Soler, Mol Vis 2006;
12:1098-1107.
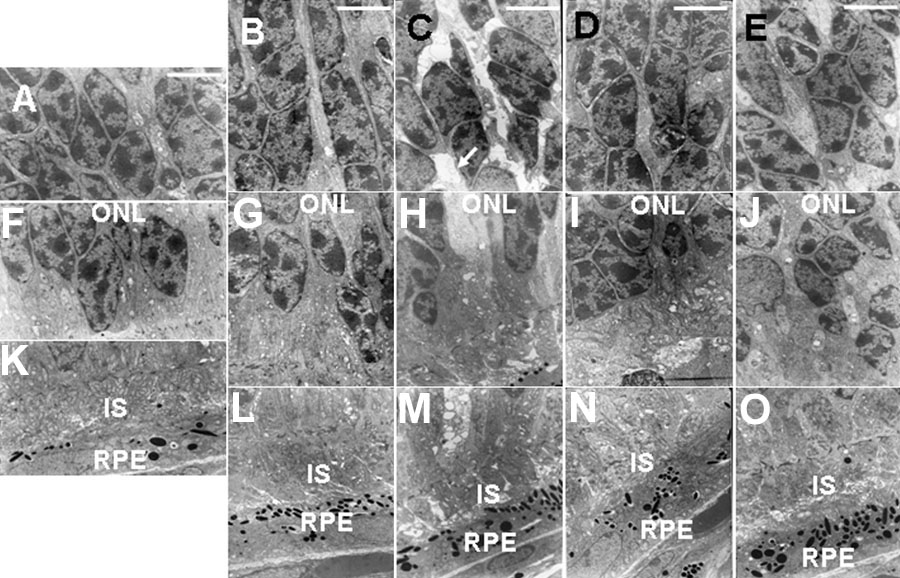
Figure 8. Ultrathin eye sections observed by transmission electron microscopy at different times after treatment
Ultrathin sections of control untreated PN7 rd1/rd1 eye section from ONL (A,F) to RPE (K). PN7 rd1/rd1 eye sections at 1 h after intravitreous injection of labeled oligonucleotides (ODNs) without prior saline iontophoresis, from ONL (B,G) to RPE (L) or with prior cathodal saline iontophoresis, from ONL (C,H) to RPE (M). PN7 rd1/rd1 eye sections at 24 h after intravitreous injection of labeled ODNs without prior saline iontophoresis, from ONL (D,I) to RPE (N) or with prior cathodal saline iontophoresis, from ONL (E,J) to RPE (O). Arrow represents vacuoles. RPE represents retinal pigment epithelium cells; IS represents inner segments; ONL represents outer nuclear layer. Scale bars represent 5 μm.