![]() Figure 6 of
Andrieu-Soler, Mol Vis 2006;
12:1098-1107.
Figure 6 of
Andrieu-Soler, Mol Vis 2006;
12:1098-1107.
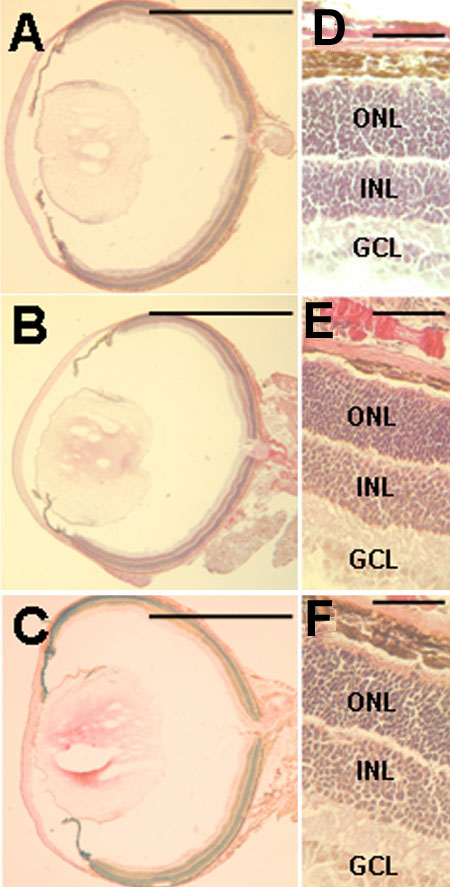
Figure 6. Eye sections from PN7 rd1/rd1 mice at different times after saline iontophoresis
Hematoxylin and eosin-stained eye sections from PN7 rd1/rd1 mice showing integrity of the eye structures at 1 h (A), 6 h (B), and 24 h (C) after treatment (cathodal saline iontophoresis immediately prior to intravitreous injection). Higher magnifications showing retina structures from the three eyes are shown in the adjacent panels (D-F). ONL represents outer nuclear layer; INL represents inner nuclear layer; GCL represents ganglion cell layer. Scale bars represent 1 mm in A-C (x2.5) and 100 μm in D-F (x25).