![]() Figure 5 of
Andrieu-Soler, Mol Vis 2006;
12:1098-1107.
Figure 5 of
Andrieu-Soler, Mol Vis 2006;
12:1098-1107.
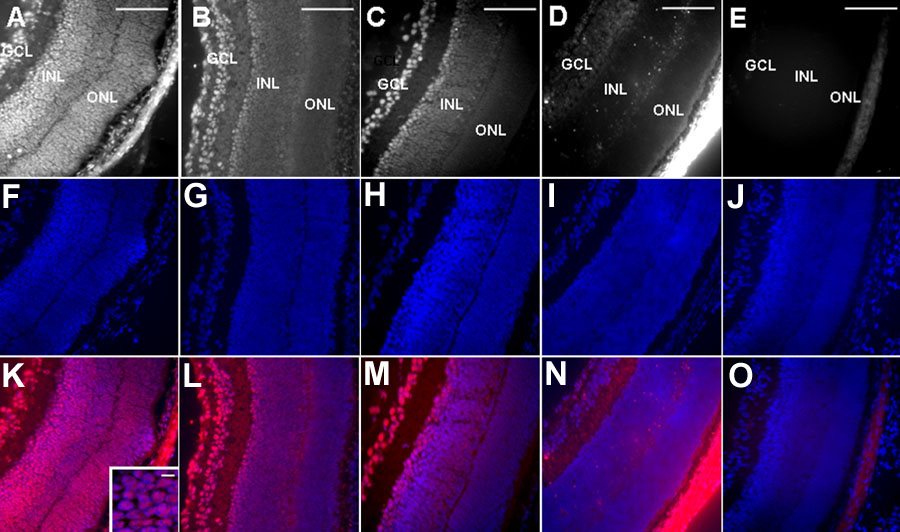
Figure 5. Penetration of oligonucleotides to retinal cells at different timea after injection with prior saline iontophoresis
Hex-labeled oligonucleotides (ODNs) in red of PN7 rd1/rd1 eye sections at 1 h (A), 4 h (B), 6 h (C), 8 h (D) and, 24 h (E) after treatment (cathodal saline iontophoresis immediately prior to intravitreous injection). DAPI staining in blue of Panels A-E is shown in corresponding middle Panels F-J. Double staining with DAPI in blue and Hex-labeled ODNs in red is shown in corresponding lower Panels K-O. Inset shows a high magnification picture of the outer nuclear layer (ONL) with double staining. INL represents inner nuclear layer, GCL represents ganglion cell layer. Scale bars represent 100 μm in A-E (x25); the scale bar in the inset represents 10 μm.