![]() Figure 3 of
Andrieu-Soler, Mol Vis 2006;
12:1098-1107.
Figure 3 of
Andrieu-Soler, Mol Vis 2006;
12:1098-1107.
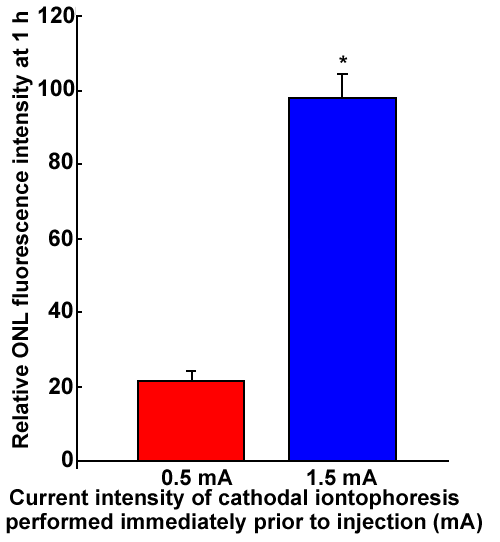
Figure 3. Analysis of the iontophoresis intensity on the penetration of oligonucleotides in the outer nuclear layer
Relative fluorescent intensities in outer nuclear layer (ONL) were represented by histograms expressed as means±SD (vertical bars). Fluorescence in the ONL shows a significant increase of intensities when using cathodal saline iontophoresis at 1.5 mA as compared to cathodal saline iontophoresis at 0.5 mA (*p<0.05).
