![]() Figure 1 of
Andrieu-Soler, Mol Vis 2006;
12:1098-1107.
Figure 1 of
Andrieu-Soler, Mol Vis 2006;
12:1098-1107.
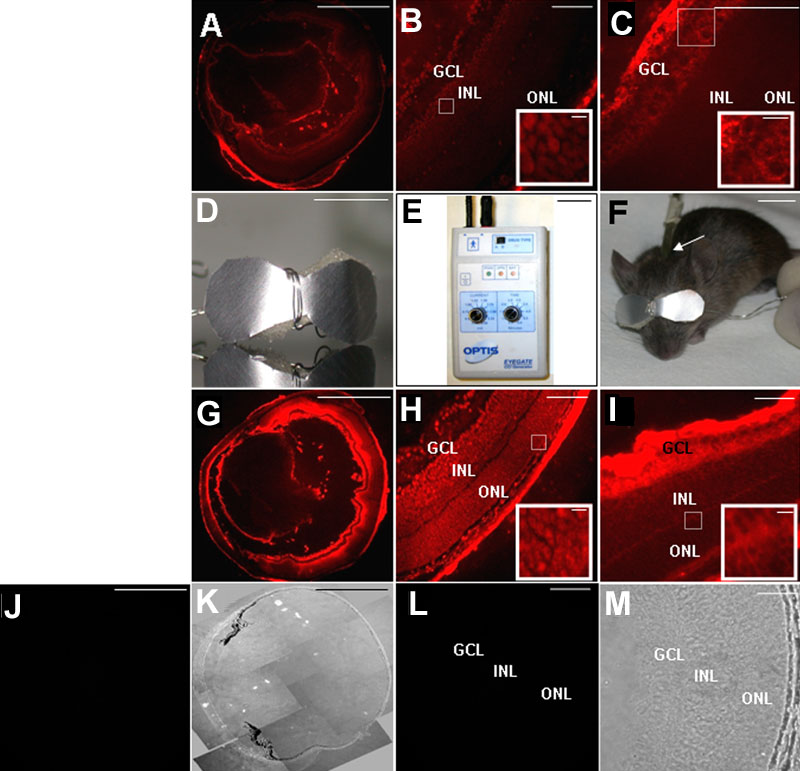
Figure 1. Penetration of oligonucleotides to retinal cells at 1 h after injection of labeled oligonucleotides with or without prior saline iontophoresis
A: PN7 rd1/rd1 eye section after intravitreal injection of labeled oligonucleotide (ODNs) without prior saline iontophoresis. B: High magnification of retina from Panel A. C: PN7 rd1/rd1 eye section after intravitreal injection of Hex without prior saline iontophoresis. D: Eyeglasses shaped electrode made with aluminum foil and single-use disposable medical grade hydrophilic polyurethane sponge. E: Iontophoresis generator. F: Mouse showing the active eyeglasses shaped electrode and the return electrode connected to the mouse's neck (arrow). G: PN7 rd1/rd1 eye section after intravitreal injection of labeled ODNs with prior cathodal saline iontophoresis. H: High magnification of retina from Panel G. I: PN7 rd1/rd1 eye section after intravitreal injection of Hex with prior cathodal saline iontophoresis. J: PN7 rd1/rd1 eye section after intravitreal injection of phosphate buffered saline with prior cathodal saline iontophoresis. K: Corresponding phase contrast of Panel J. L: Higher magnification of retina from Panel J. M: Corresponding phase contrast of Panel L. Insets show high magnification of the correspondent picture. ONL represents outer nuclear layer; INL represents inner nuclear layer; GCL represents ganglion cell layer. Scale bars represent 1 mm in A,G,J,K (x2.5), 100 μm in B,C,H,I,L,M (x25), 0.5 cm in D,F, 2 cm in E, and 10 μm in the insets.