![]() Figure 6 of
Colitz, Mol Vis 2006;
12:1067-1076.
Figure 6 of
Colitz, Mol Vis 2006;
12:1067-1076.
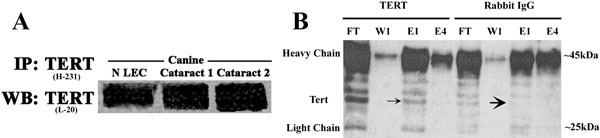
Figure 6.
Immunoprecipitation of TERT (H-231) followed by western blot analysis using anti-TERT (L-20) antibody (A). Though not quantitative, this confirms the western blot data which demonstrated TERT expression in normal and cataractous LEC. The kit used for this experiment was the Seize Mammalian method by Pierce. B: Normal LEC (shown) and cataractous LEC (not shown) were subjected to coimmunoprecipitation using the Catch and Release kit by Upstate cell signaling solutions. FT is the flow-through, W1 is the first wash, E1 and E4 are the first and fourth elutions. The upper band is the heavy chain, and lower band is the light chain. TERT is present in the sample (small arrow) and is absent in the IgG control (large arrow).