![]() Figure 3 of
Gendron, Mol Vis 2006;
12:108-116.
Figure 3 of
Gendron, Mol Vis 2006;
12:108-116.
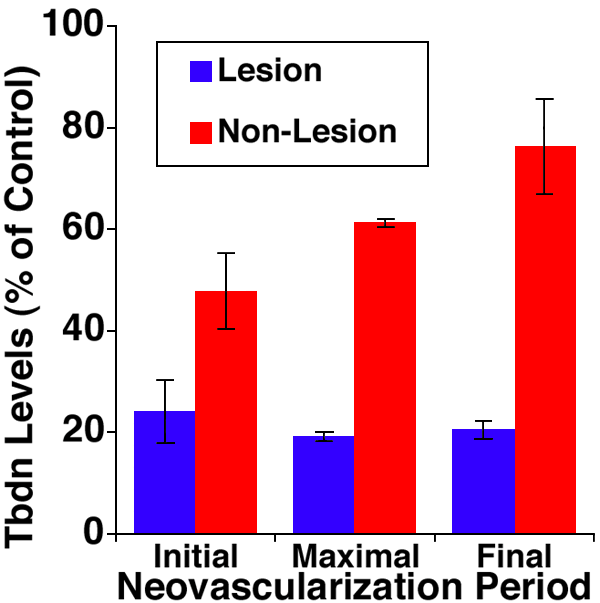
Figure 3. Quantitative analysis of Tbdn-1 expression in oxygen-induced retinopathy in mice
Analysis of Tbdn-1 expression levels from initial period (P15), maximal period (P17), and final period of neovascularization (P26) in lesion areas of the retina (blue bars) compared to non-lesional areas of the retina (red bars) in hyperoxia-reared mice expressed as a percentage of the values for the control normoxia-reared mice; error bars represent SEM. "Lesion" refers to areas within retinal lesions displaying neovascularization, while "Non-Lesion" represents areas outside retinal lesions displaying no neovascularization. Bars represent means of 3 to 6 representative digital images from normoxia controls and hyperoxia-treated mice. All but the non-lesion final neovascularization period (P26; p=0.26) were significantly different from controls (p<0.04).
