![]() Figure 4 of
Paez, Mol Vis 2006;
12:1048-1056.
Figure 4 of
Paez, Mol Vis 2006;
12:1048-1056.
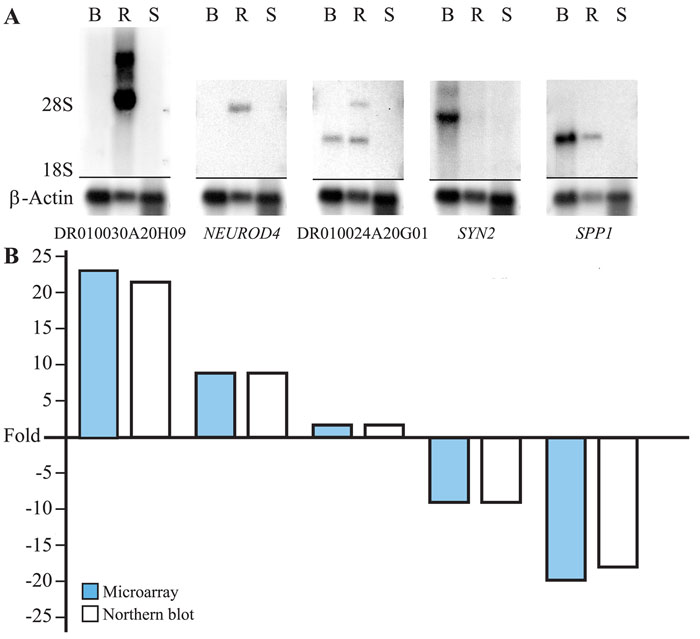
Figure 4. Northern blot validation of selected genes
A: Expression profile for selected genes was obtained from northern analysis using brain (B), retina (R), and spleen (S) through normalization against the canine β-actin loading control, and compared to microarray results (B). NEUROD4: neurogenic differentiation 4; SYN2: synapsin II; SPP1: secreted phosphoprotein 1.