![]() Figure 1 of
Paez, Mol Vis 2006;
12:1048-1056.
Figure 1 of
Paez, Mol Vis 2006;
12:1048-1056.
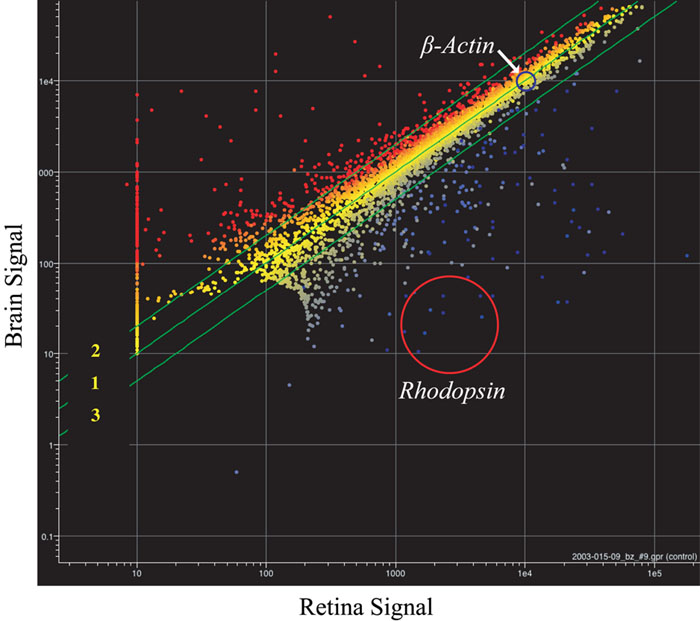
Figure 1. MA-plot comparing gene expression in retina and brain reference pool
Each point represents a single transcript/spot on the array, plotted as a function of its signal amplitude (expression level) for brain pool and retina. Line 1 denotes equivalent expression in retina and brain, whereas lines 2 and 3 indicate a two-fold difference in the signal strength. For illustration, spots representing Rhodopsin, much more abundant in retina than brain, are located within the red circle, while the uniformly expressed β-Actin spots lie within the blue circle.