![]() Figure 4 of
Sharif, Mol Vis 2006;
12:1040-1047.
Figure 4 of
Sharif, Mol Vis 2006;
12:1040-1047.
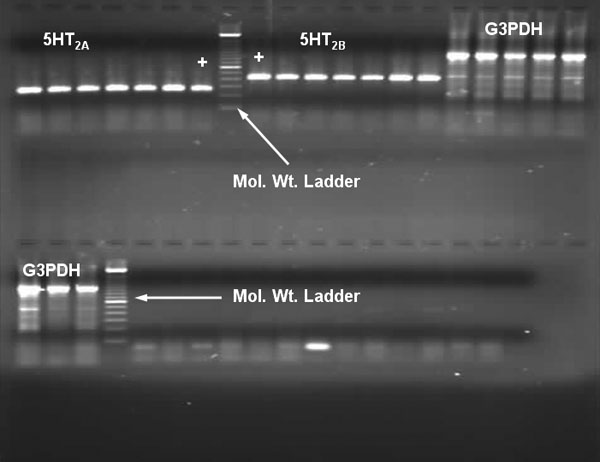
Figure 4.
RT-PCR mRNA signals for 5HT2A and 5HT2B mRNA signals in human ciliary body samples. The top left side of the figure shows the 5HT2A mRNA signals (along with a positive control, brain, shown with a plus sign) from individual donor samples followed by the molecular weight ladder, and then the 5HT2B mRNA signals and the respective positive control. The top right side (and bottom left side) of the figure shows the mRNA signals for the internal control house-keeping enzyme, glycerol-3-phosphate dehydrogenase (G3PDH).