![]() Figure 5 of
Thaler, Mol Vis 2006;
12:100-107.
Figure 5 of
Thaler, Mol Vis 2006;
12:100-107.
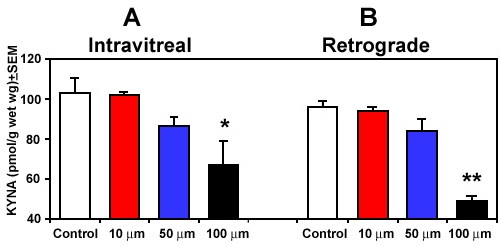
Figure 5. Retinal kynurenic acid content 4 days after ODN administration
Each column represents the mean kynurenic acid (KYNA) concentration (pmol/g wet weight); error bars represent the standard errors of the mean. A: Retinal KYNA concentration after intravitreal oligonucleotides administration, B: Retinal KYNA concentration after retrograde ODN administration. Columns show retinal KYNA concentration 4 days after administration of 100 μM scrambled ODN as a control (white column), 10 μM ODN (red column), 50 μM ODN (blue column), and 100 μM ODN (black column). Asterisks indicate significantly different KYNA content in a group compared to its respective control (* for p<0.01; ** for p<0.001) by unpaired t-test.