![]() Figure 4 of
Thaler, Mol Vis 2006;
12:100-107.
Figure 4 of
Thaler, Mol Vis 2006;
12:100-107.
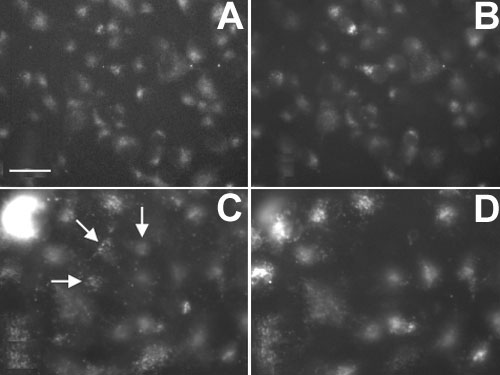
Figure 4. Co-staining of retinal ganglion cell with fluorescently labeled ODN and the retrograde tracer Fluorogold
Flat-mounts of rat retina showing retinal ganglion cells with retrograde labeling by injection of Fluorogold (FG). A,C: Monochromatic excitation at 540 nm (Cy3). B,D: Monochromatic excitation at 360 nm (FG). A,B: Three days after injections of Cy3-labeled ODN into the superior colliculus, all cells stained with fluorogold (B) are also positive for Cy3 (A). C,D: Three days after intravitreal injections of Cy3-labeled ODN, all cells stained with fluorogold (D) are also positive for Cy3 (C). Importantly additional cells are stained with Cy3 (C, white arrows), but not with fluorogold (D). The scale bar represents 25 μm.