![]() Figure 3 of
Thaler, Mol Vis 2006;
12:100-107.
Figure 3 of
Thaler, Mol Vis 2006;
12:100-107.
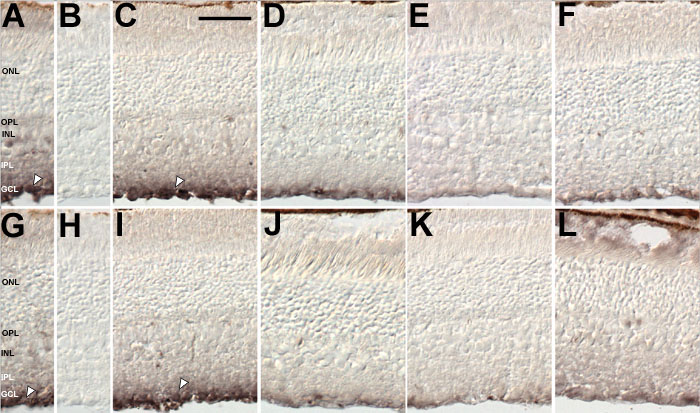
Figure 3. KAT II immunohistochemistry
Retinal cross sections of rats are shown after retrograde treatment (C-F). C: Three days after injection of scrambled ODN. D: 1 day after injections of antisense ODN into the superior colliculi of Brown Norway (BN) rats. E: 3 days after injections of antisense ODN into the superior colliculi of BN rats. F: 7 days after injections of antisense ODN into the superior colliculi of BN rats. Retinal cross sections of rats are shown after intravitreal injection of KAT II oligonucleotides (I-L). I: 3 days after injection of scrambled ODN. J: 1 day after injections of antisense ODN into the vitreous body of BN rats. K: 3 days after injections of antisense ODN into the vitreous body of BN rats. L: 7 days after injections of antisense ODN into the vitreous body of BN rats. KAT II staining is reduced after either way of application. The signal is weakest three days after ODN injection. Retinal cross sections of untreated rats are shown as controls (A,B,G,H). The retinal ganglion cell layer is oriented downwards. DAB staining for KATII. G: KAT II staining of untreated BN rat retina. All cells in the GCL are uniformly stained (white arrowheads). H: Negative control. The outer nuclear layer (ONL), outer plexiform layer (OPL), inner nuclear layer (INL), inner plexiform layer (IPL), and ganglion cell layer (GCL) are identified. The scale bar represents 50 μm.