![]() Figure 2 of
Thaler, Mol Vis 2006;
12:100-107.
Figure 2 of
Thaler, Mol Vis 2006;
12:100-107.
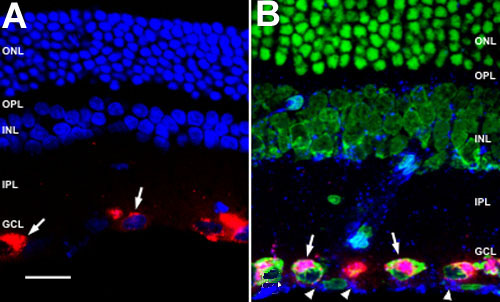
Figure 2. Laser scanning microscopy
Confocal laser scanning microscopic view of retinal sections of rats three days after treatment. A: Cross section after retrograde treatment with Cy3-labeled oligonucleotides (red). Nuclei are stained with Torpro (blue). Cy3-fluorescence is clearly visible in cells in the ganglion cell layer (GCL; white arrows) but not in Müller cell endfeet. B: Cross section after intravitreal injection of Cy5-labeled ODN (blue). Nuclei are stained with Yopro (green). Retinal ganglion cells are labeled with DiI (red). Cy5-ODN and DiI is co-localized in RGCs (white arrows). Note the Cy5 positive staining of the Müller cell endfeet (white arrowheads), inner plexiform layer (IPL), inner nuclear layer (INL), and the outer plexiform layer (OPL), and the weak staining in the outer nuclear layer (ONL), here it is not localized to the nucleus. The scale bar represents 25 μm.