![]() Figure 1 of
Thaler, Mol Vis 2006;
12:100-107.
Figure 1 of
Thaler, Mol Vis 2006;
12:100-107.
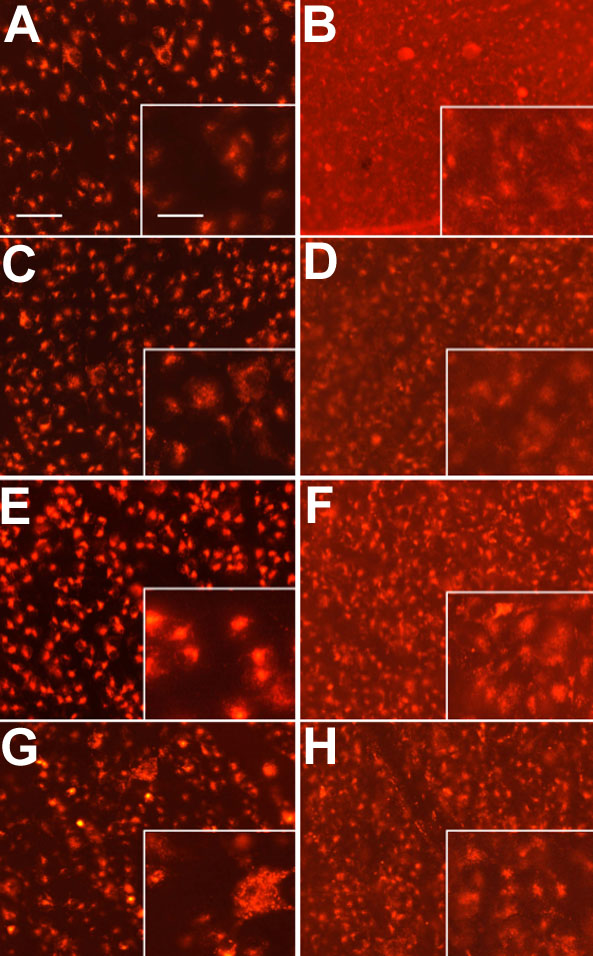
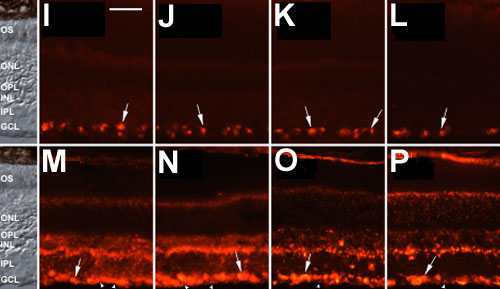
Figure 1. Fluorescently labeled oligonucleotides in retinal flat-mounts and cross sections
Antisense oligonucleotides (ODNs) are coupled to the fluorescent tracer Cy3. Flat-mounts of rat retinas after injections of Cy3-ODN into superior colliculi of Brown Norway (BN) rats are shown at different times (A,C,E,G), focused on the retinal ganglion cell layer (GCL). A: 1 day. C: 3 days. E: 7 days. G: 2 weeks. Flat-mounts of rat retinas after injections of Cy3-ODN into the vitreous body of BN rats are shown at different times (B,D,F,H), focused on the retinal ganglion cell layer. B: 1 day. D: 3 days. F: 7 days. H: 2 weeks. The staining pattern remained strong over the whole period of time. Note the homogeneous distribution after either way of application. B,D,F,H: Note the labeling of cells distinct from ganglion cells after intravitreal application which appear out of focus and therefore blurred. A more accurate view on the localization of cells in different retinal layers is given in the pictures of retinal slices (I-M). Retinal cross sections of rats after injections of Cy3-ODN into superior colliculi of BN rats are shown at different times (I-L). I: 1 day. J: 3 days. K: 7 days. L: 2 weeks. Staining is clearly visible in cells of the GCL (white arrows), while other parts of the retina do not display any detectable fluorescence. Retinal cross sections of rats after injections of Cy3-ODN into the vitreous body of BN rats are shown at different times (M-P). M: 1 day. N: 3 days. O: 7 days. P: 2 weeks. Cells are strongly stained within the GCL (white arrows) and in the inner part of the inner nuclear layer (INL). Note the clear staining in Müller cell endfeet (white arrowheads). A more diffuse signal was seen in the outer part of the INL and in the inner plexiform layer (IPL). In the outer plexiform layer (OPL), little staining occurs, whereas within the outer nuclear layer (ONL), Cy3 fluorescence is visible although likely to be extracellular. In the outer segments no fluorescence is detectable. Sections at other times up to 8 weeks showed a similar appearance (data not shown). The scale bar represents 50 μm (A-P) and 25 μm in the insets (A-H).