![]() Figure 8 of
Mader, Mol Vis 2006;
12:915-930.
Figure 8 of
Mader, Mol Vis 2006;
12:915-930.
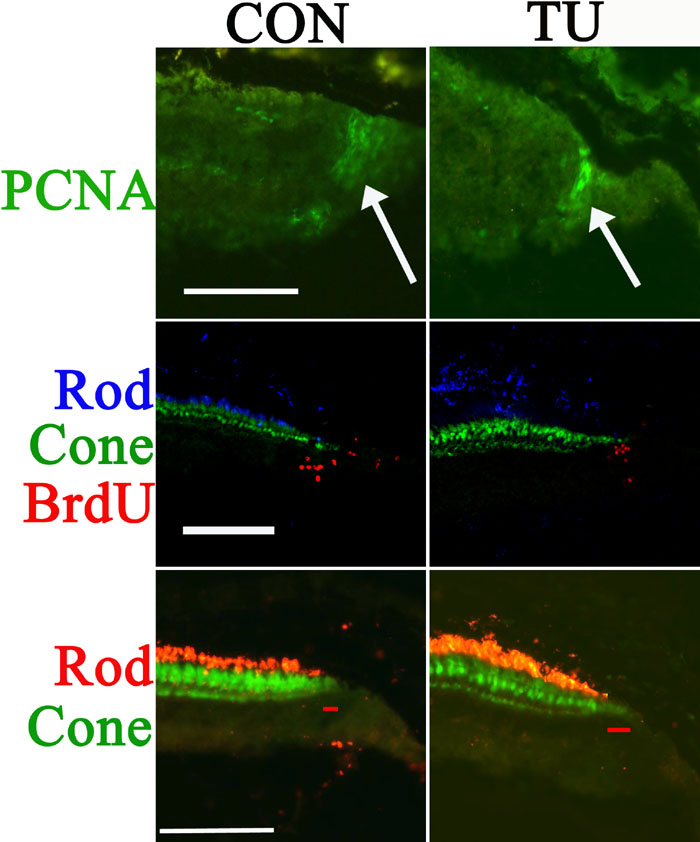
Figure 8. Retinal growth in control and hypothyroidic postmetamorphic flounder retina
The source/condition of the displayed cryosections is indicated along the top of each column, and the identities of the screened primary antibodies are indicated to the left of each row, color-coded to the corresponding label. Top: Anti-PCNA labeled cells at the CGZ in both conditions (white arrows), suggesting that TU exposure did not affect precursor cell proliferation. Middle: The displacement of BrdU-positive cells (red) from the CGZ, at retinal regions that correspond to the location of rods (anti-rhodopsin; blue marker) and cones (zpr-1; green marker), in both conditions suggest that TU exposure did not hinder cytogenesis or radial growth at the CGZ. Bottom: With respect to the labeled cells nearest to the CGZ, there was a greater distance between the rods (anti-rhodopsin; red marker) and cones (zpr1; green marker) in the hypothyroidic condition compared to control; cf. the thick red lines in each panel. Scale bars for each row represent 100 μm.