![]() Figure 1 of
Mader, Mol Vis 2006;
12:915-930.
Figure 1 of
Mader, Mol Vis 2006;
12:915-930.
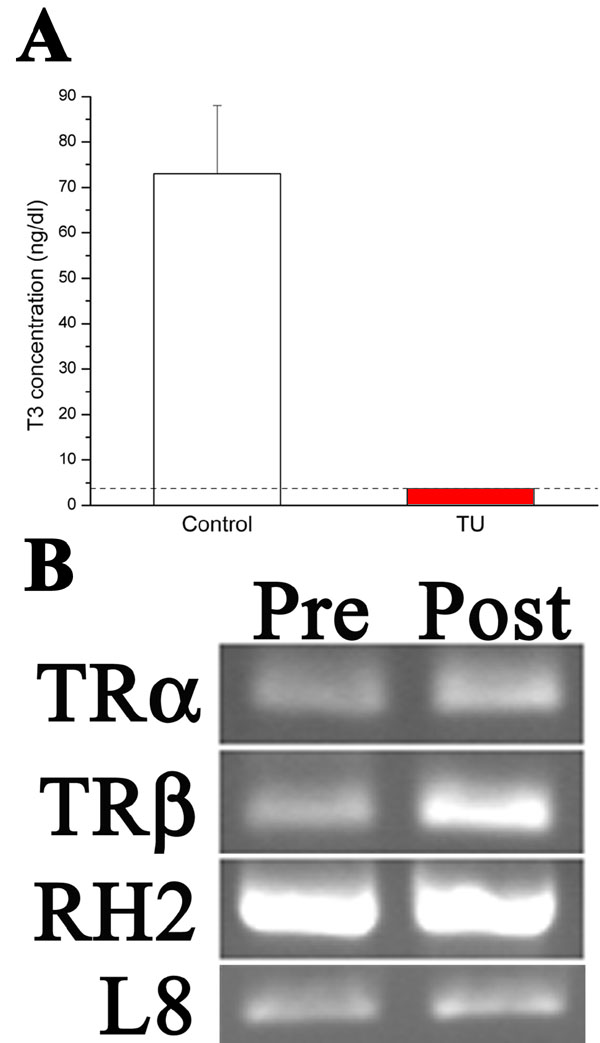
Figure 1. Effects of TU exposure and evidence of TR expression in flounder retina
A: Radioimmunoassay (RIA) of TH in control and TU-exposed fish. RIA analysis of serum samples indicated evidence for T3 in control fish, but no detectable T3 in fish exposed to TU. The dotted line indicates the minimum detectable level of T3, which represents approximately 5% of the level observed for control fish. B: RT-PCR analysis of TR expression in winter flounder. Both TRα and TRβ are expressed in premetamorphic animals (Pre) and postmetamorphic retina (Post). Identity of amplified products was confirmed with sequencing. RT-PCR analysis of RH2 ("green" cone opsin) [32] and 60S ribosomal protein L8 (L8) served as positive controls. C: Nucleotide and amino acid sequences of winter flounder TRα and TRβ. Left, Nucleotide sequence of the TRα mRNA coding region, with inferred amino acid sequence. The expected c4 zinc finger DNA-binding domain (underlined region spanning amino acids 55-126) and ligand-binding domain (underlined region spanning amino acids 226-381) were evident. Right, Nucleotide sequence of the TRβ mRNA coding region, with inferred amino acid sequence. The DNA- and ligand-binding domains (amino acids 28-102 and 228-385, respectively) are indicated. The unique 20 amino acid region is indicated in gray. The symbol number indicates the stop codon.