![]() Figure 3 of
Chakarova, Mol Vis 2006;
12:909-914.
Figure 3 of
Chakarova, Mol Vis 2006;
12:909-914.
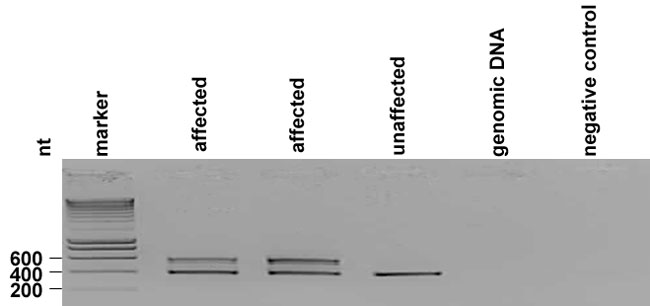
Figure 3. cDNA analysis by RT-PCR
Gel electrophoresis of PCR products obtained with specific cDNA primers of one unaffected and two affected individuals from Family 1A. In the affected individuals, a heterozygous pattern of bands migrating at 391 and 579 nt is seen due to unspliced intron 6 in one of the alleles. The unaffected individual shows only one band of 391 nt amplified from cDNA containing exons 5, 6, and 7.