![]() Figure 3 of
Steiner-Champliaud, Mol Vis 2006;
12:892-901.
Figure 3 of
Steiner-Champliaud, Mol Vis 2006;
12:892-901.
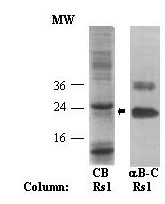
Figure 3. Interaction of retinoschisin with αB-crystallin
Left lane: Low molecular mass proteins eluted from Rs1 column and αB crystallin western blotting. Coomassie blue stained low molecular mass (<60 kDa) fraction showed multiple bands between 50 and 60 kDa, and major bands at about 25 and 10 kDa. The 25 kDa band represents Rs1 itself. Excision and sequencing of the band located just below (indicated by an arrow) identified this 24 kDa species as αB crystallin. Right lane: Western blotting of same eluate using anti-αB crystallin antibody indicated strong immunoreactivity of 23 kDa band, and moderate staining of about 38 kDa band, possibly a dimer. Molecular weight (MW) standards in kDa shown on left.