![]() Figure 3 of
Maeda, Mol Vis 2006;
12:885-891.
Figure 3 of
Maeda, Mol Vis 2006;
12:885-891.
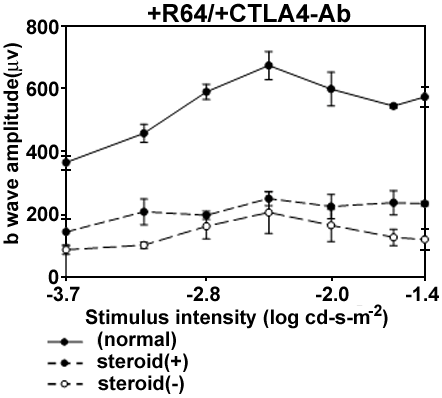
Figure 3. Dark-adapted ERG responses in steroid treated mice
Intensity-response curve of the amplitude of flash b-wave from the dark-adapted electroretinagram (ERG). The ERG responses were recorded from three mice in each group at various intensities (-3.7 to -1.4 log cd s m-2). Mice were immunized with 50 μg of R64 recoverin-derived peptide three times on days 0, 6, and 20 after the first immunization. Anti-CTLA4 antibody was given intraperitoneally to mice on days 0, 3, and 6 after the first immunization, at a concentration of 100 μg/mouse. On days 7 and 21 after the first peptide immunization, steroid was given subconjunctively at dose of 50 mg/kg/body weight. On day 35 post-immunization, ERGs were recorded. Five mice were employed per each group. Error bars represent standard error of the mean. There were significant differences between normal and both groups of CAR-induced mice (steroid (-) and steroid (+)) at all intensities (p<0.001 with ANOVA test). Among CAR-induced mice, there was an increased response in the steroid(+) mice at three of seven light intensities tested (-3.2, -1.6, and -1.4 log cd s m-2, p<0.01 by ANOVA) and a trend towards an increased light response at the other four intensities.
