![]() Figure 2 of
Beattie, Mol Vis 2005;
11:825-832.
Figure 2 of
Beattie, Mol Vis 2005;
11:825-832.
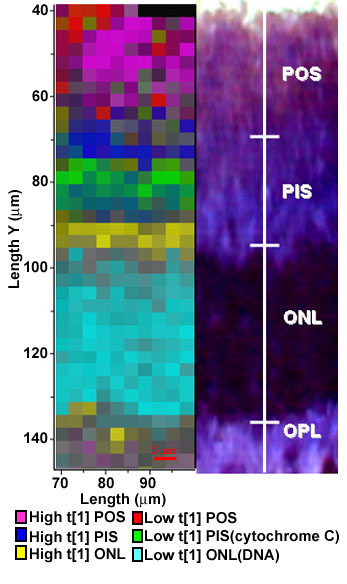
Figure 2. Raman map of major spectral components
A Raman map (left image) shows the distribution of major spectral components in the outer segments of the area centralis of porcine retina, identified using principal component analysis for each of the histologically distinct regions. The photoreceptor outer segments (POS), photoreceptor inner segments (PIS), outer nuclear layer (ONL), and outer plexiform layer (OPL) are labeled. High t[1] and low t[1] refer to the two extreme values of the first principal components and represent the main source of spectral variation in each layer. For comparison, the optical image (right) of the specimen after histological staining is shown alongside the Raman map. Maps recorded for two independent samples were in good agreement. One of these is displayed here. The scale bar denotes 5 μm.