![]() Figure 3 of
Kirwan, Mol Vis 2005;
11:798-810.
Figure 3 of
Kirwan, Mol Vis 2005;
11:798-810.
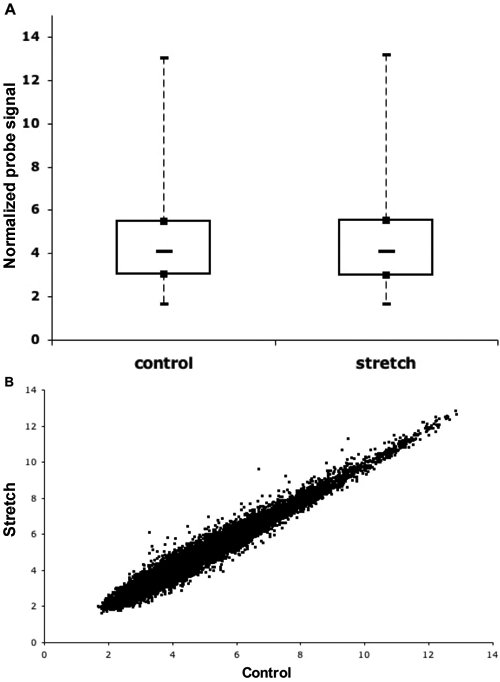
Figure 3. Summary of microarray analysis
A: Box plot distribution of average probe set expression levels as measured by robust multi-chip (RMA) analysis. The two microarrays are shown representing hybridization of pooled RNA from three separate stretch and control experiments. B: Scatter plot pairwise comparison of the log transformed and normalized expression levels of the 22,283 genes on the HG-U133A array.
