![]() Figure 7 of
Cameron, Mol Vis 2005;
11:775-791.
Figure 7 of
Cameron, Mol Vis 2005;
11:775-791.
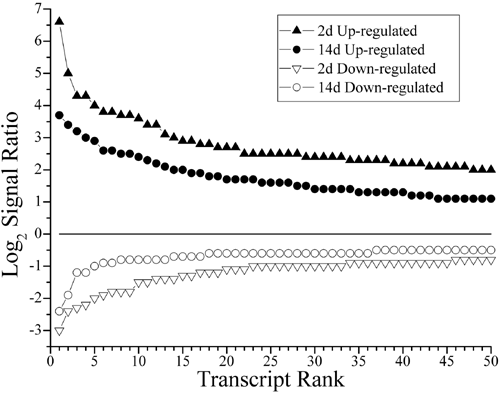
Figure 7. Condition-specific transcripts in zebrafish retina
The fifty most condition-specific, significantly up- and downregulated transcripts for post-lesion retinas are plotted as log2 of the transcripts' signal ratio between lesion and control samples. Each rank corresponds to an individual gene, with the ratio determined by dividing that gene's signal amplitude between the time-matched control and lesioned retina. For both the 2 d and 14 d post-lesion conditions the most significantly affected transcripts tend to be enhanced in post-lesion retina (solid symbols), as opposed to downregulated (open symbols). The overall amplitude of the expression differences are greater at 2 d than at 14 d post-lesion.