![]() Figure 10 of
Cameron, Mol Vis 2005;
11:775-791.
Figure 10 of
Cameron, Mol Vis 2005;
11:775-791.
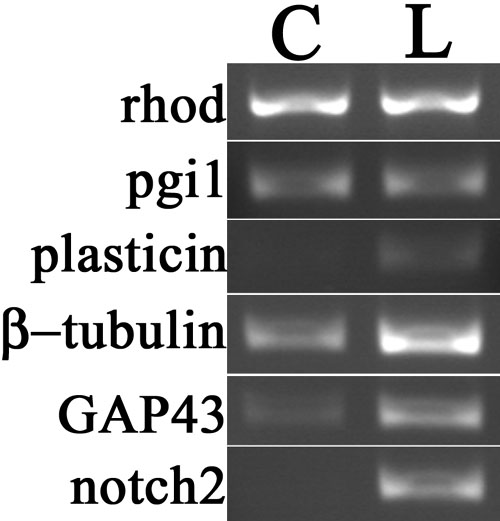
Figure 10. Gel electrophoresis analysis of gene transcripts amplified by RT-PCR from zebrafish retina 14 d post-lesion
Amplified products for control (C) and 2 d post-lesion retina (L) are shown, encoding rhod, pgi1, plasticin, γ-tubulin, GAP43, and notch2.