![]() Figure 1 of
Seomun, Mol Vis 2005;
11:764-774.
Figure 1 of
Seomun, Mol Vis 2005;
11:764-774.
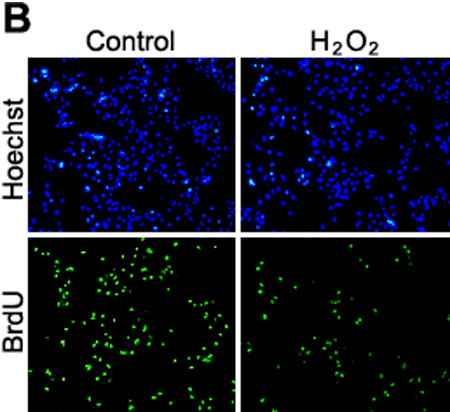
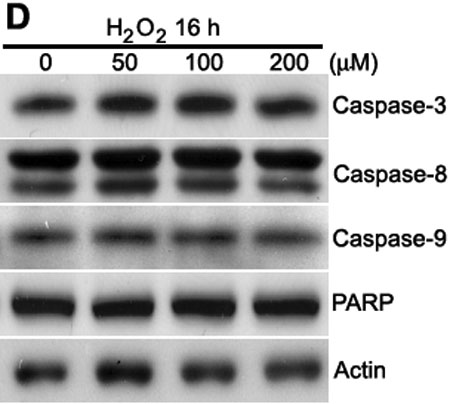
Figure 1. Effect of H2O2 in human LECs
A: HLE B-3 cells were exposed to multiple concentrations of H2O2 for 24 h and then, the surviving cells were harvested and counted. The mean total cell numbers of three independent determinations are represented by the points and the error bars represent the standard deviation. B: The cells were treated with 200 μM of H2O2 for 24 h, and pulsed with BrdU for an additional 40 min, then fixed. Immunofluorescence of BrdU was performed to detect BrdU incorporation (lower, green), and nuclear staining was done with Hoechst 33342 (upper, blue). C: The DNA content of HLE B-3 cells with 50 μM, 100 μM, and 200 μM of H2O2 for 24 h, respectively, were analyzed using FACS analysis. Control cells were incubated in serum free media for 24 h without H2O2. The lower graph showed the percentage in each cell cycle. There was a significant shift toward G2/M (from 21% to 68.4%) in the H2O2 treated cells while the proportion of cells in G0/G1 and S decreased from 48.2% to 13.3% and from 30.8% to 18.3%, respectively. D: Under same conditions as described in C, the expression of caspase-3, caspase-8, and caspase-9 did not change and the activated forms of these enzymes were not detected by western blot analysis. The results shown are representative of three independent experiments.