![]() Figure 4 of
Fan, Mol Vis 2005;
11:76-87.
Figure 4 of
Fan, Mol Vis 2005;
11:76-87.
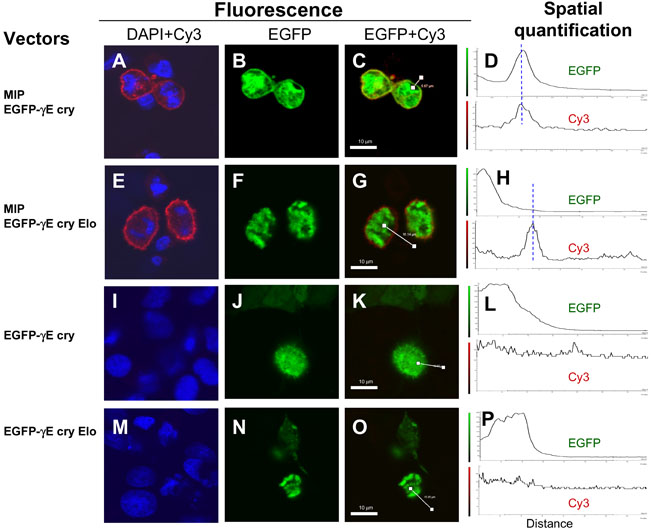
Figure 4. The γE-crystallin Elo mutant does not interact with MIP
RK13 cells were transfected with one of the following combinations of expression plasmids: pCMV-MIP and pEGFP-γE cry (A-D), pCMV-MIP and pEGFP-γE cry Elo (E-H), pEGFP-γE cry (I-L), or pEGFP-γE cry Elo (M-P). Forty-eight h after transfection, the cells were fixed with a buffer containing 4% paraformaldehyde. After blocking in ICC buffer containing 5% normal goat serum, the cells were incubated first with 20 μg/ml of rabbit anti-human MIP antibody. After washing, the cells were then incubated with biotin-SP conjugated goat anti-rabbit IgG, followed by washing and incubation with Cy3 conjugated streptavidin and 4,6,-diamidino-2-phenylindole dihydrochloride, hydrate (DAPI). The cells were washed extensively and visualized by confocal fluorescence microscopy. For details, see the Methods section. Images or merged images from three channels of fluorescence (DAPI, Cy3, EGFP) were obtained: DAPI+Cy3 (A,E,I,M), EGFP (B,F,J,N), and EFGP+Cy3 (C,G,K,O). Spatial quantification (D,H,L,P) was performed along a path across the plasma membrane, indicated by a white line (C, G,K,O). EGFP fluorescence and Cy3 fluorescence was quantified separately and plotted as a function of distance along the path. Blue lines (D,H,L,P) indicated the approximate location of the plasma membrane. The white bars in C, G, K, and O represent 10 μm. Photographs and spatial quantification graphs shown are representatives of those obtained from at least six different fields.