![]() Figure 3 of
Shan, Mol Vis 2005;
11:738-743.
Figure 3 of
Shan, Mol Vis 2005;
11:738-743.
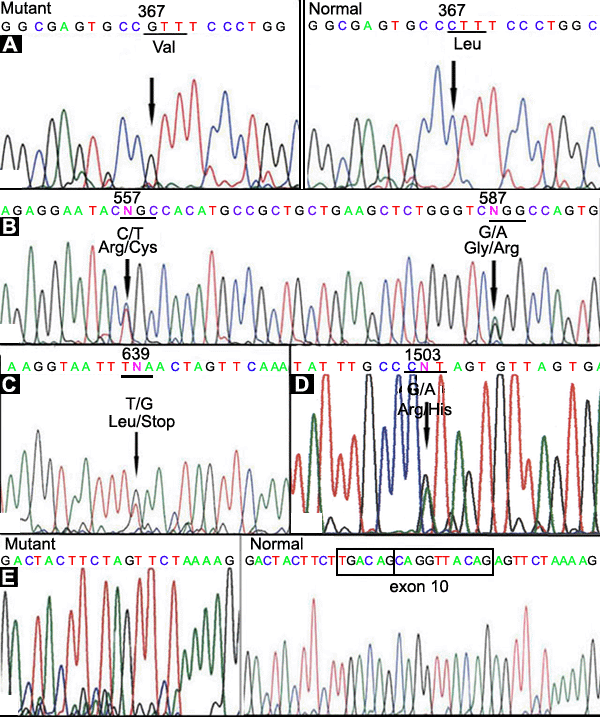
Figure 3. Direct sequencing analysis of the coding region of CYP4V2
A: The left side shows the homozygous mutant single-base pair change (CTT->GTT, L22V) and the right side shows the corresponding normal sequence. B: Heterozygous changes (CGC->TGC R85C and GGG->AGG G95R). C: Heterozygous sequence variant (TTA->TGA L112X). D: Heterozygous single-base pair change (CGT->CAT, R400H). E: The left side shows a 16 bp deletion mutation (IVS9-6del TGACAGCAGGTTACAG including exon 10 splice-acceptor site) and the right side shows the corresponding normal sequence. The deleted nucleotides are in the frame. All sequences above are in the sense direction.
