![]() Figure 4 of
Chan, Mol Vis 2005;
11:697-704.
Figure 4 of
Chan, Mol Vis 2005;
11:697-704.
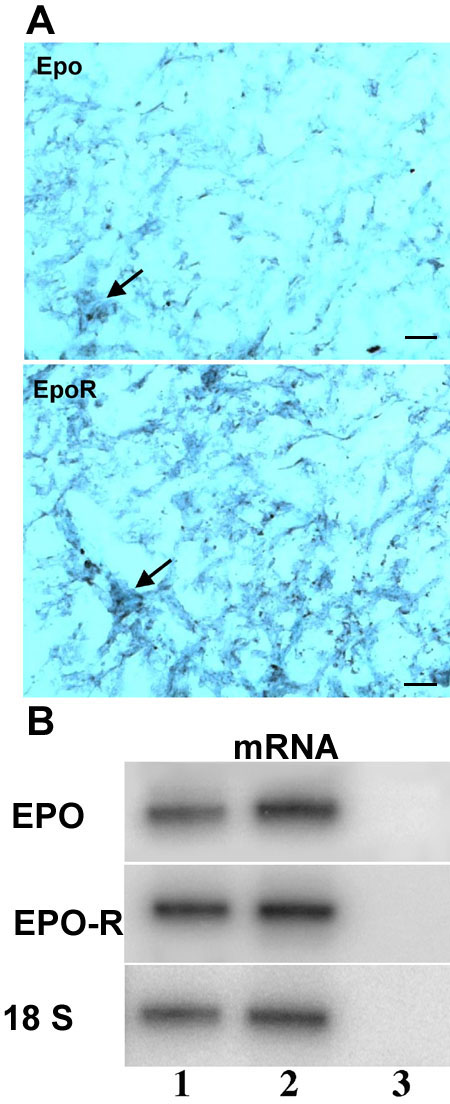
Figure 4. Epo and EpoR in retinal hemangioblastoma
A: microphotographs show the expression of Epo- and EpoR-staining cells (black bluish color, arrows) on the VHL lesion. The images labeled epo and epoR were reacted with primary antibodies, respectively, against epo and epoR, secondary biotin-conjugated antibodies, and avidin-biotin-peroxidase complex, and counterstained with methyl green. The original magnification was 200x. The scale bar represents 40 μm. B: Autoradiography showed expression of Epo mRNA and EpoR mRNA from VHL cells in two cases analyzed by RT-PCR (lanes 1 and 2). Lane 3 is a negative control, in which microdissected RNA was omitted. The primer sequences are from [18]. Both RT-PCR primer pairs spanned at least one intron. The expected products for Epo, EpoR, and 18S are 276 bp, 224 bp, and 459 bp, respectively. The RNA from the isolation of the microdisscted cells was digested with DNase 1 for several hours. The RT-PCR resulted in a single band of the expected size from an mRNA template. This indicates that there is no genomic DNA contamination, which would create a band of a larger size if intronic sequences were present.