![]() Figure 3 of
Delyfer, Mol Vis 2005;
11:688-696.
Figure 3 of
Delyfer, Mol Vis 2005;
11:688-696.
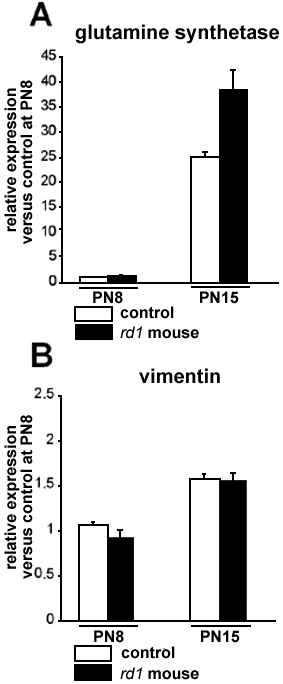
Figure 3. Glutamine synthetase and vimentin mRNA expressions
Glutamine synthetase (A) and vimentin (B) mRNA levels in rd1 and control retinas at PN8 and PN15 were measured using real-time RT-PCR. Bars represent the mean of triplicate determinations; the error bars represent the standard error of the mean.
