![]() Figure 2 of
Delyfer, Mol Vis 2005;
11:688-696.
Figure 2 of
Delyfer, Mol Vis 2005;
11:688-696.
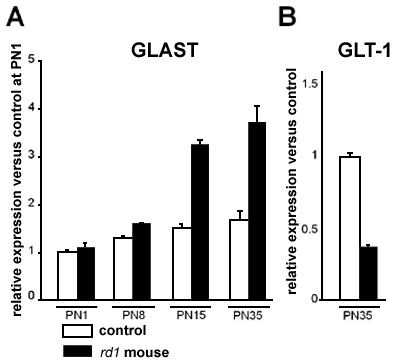
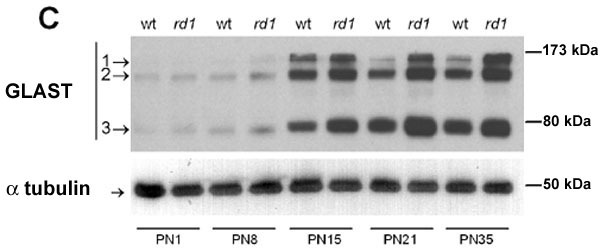
Figure 2. GLAST expression during photoreceptor degeneration
GLAST mRNA expression levels were measured in retinas from untreated rd1 and control retinas during photoreceptor degeneration. Semi-quantitative analyses of GLAST (A) and GLT-1 (B) mRNA levels were measured using real-time RT-PCR. Bars represent the mean of triplicate determinations; the error bars represent the standard error of the mean. C: Western blots of total protein (10 μg/lane) prepared from rd1 and control retinas at PN1, PN8, PN15, P21, and PN35, and the blots were probed with anti-GLAST and anti-α-tubulin antibodies. The blots demonstrated bands at about 50 kDa (α-tubulin), at about 76 kDa (GLAST monomeric form, labeled 3), and two bands at about 160 kDa (GLAST multimeric forms, labeled 1 and 2). Results are representative of three independent experiments.