![]() Figure 4 of
Delyfer, Mol Vis 2005;
11:677-687.
Figure 4 of
Delyfer, Mol Vis 2005;
11:677-687.
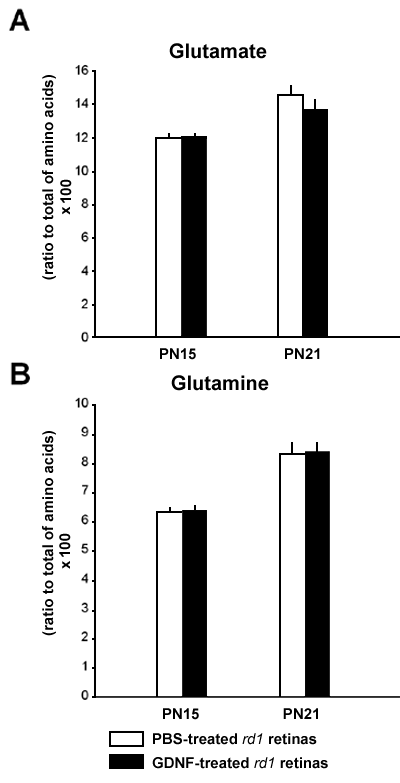
Figure 4. Free glutamate and glutamine levels in rd1 and control retinas after subretinal injection of GDNF or PBS
Free glutamate (A) and glutamine (B) levels were measured in rd1 and control retinas at PN15 and PN21, 48 h after subretinal injection of either GDNF or PBS. The bars represent the mean proportion (as a percentage) of amino acids that are glutamine and glutamate. Bars represent the mean (n=11); the error bars represent the standard error of the mean.
