![]() Figure 2 of
Delyfer, Mol Vis 2005;
11:677-687.
Figure 2 of
Delyfer, Mol Vis 2005;
11:677-687.
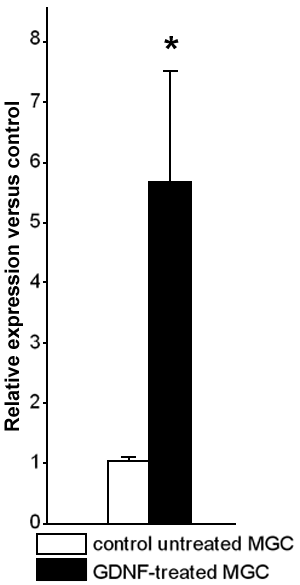
Figure 2. GLAST mRNA expression in Müller glial cell (MGC) cultures treated with GDNF
GLAST mRNA levels were studied in MGC cultures in the presence and absence of GDNF using real-time RT-PCR. Bars represent the mean of three independent experiments; the error bars represent the standard error of the mean (asterisk indicates p<0.05, n=3).
