![]() Figure 1 of
Delyfer, Mol Vis 2005;
11:677-687.
Figure 1 of
Delyfer, Mol Vis 2005;
11:677-687.
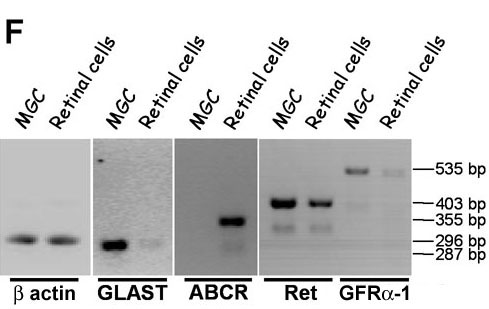
Figure 1. Rod arrestin, GDNF, GFRα-1, Ret, and GFRα-2 mRNA expression in the rd1 retina
In vivo levels of rod arrestin (A), GDNF (B), GFRα-1 (C), Ret (D), and GFRα-2 (E) mRNA expression were measured in rd1 and wild-type retinas during rod degeneration (PN8, PN15, and PN35) using semi-quantitative real-time RT-PCR. Bars represent the mean of triplicate determinations; the error bars represent the standard error of the mean. The open bars represent wild-type mice, and the solid black bars represent rd1 mice. These graphs show data relative to the lowest value of PN8 control and not relative to the mean value of PN8 control. In the case of rod arrestin (A), expression data was plotted relative to the lowest value obtained, regardless of the age or strain. Concerning markers of rod photoreceptors, the lowest value was observed in 35-day-old rd1 mouse retinas because there are no more surviving rods then. Therefore, rod arrestin data were expressed in comparison to PN35 rd1 retinas. F: Gel electrophoresis of PCR products after amplification of first-strand cDNA from pure Müller glial cell (MGC) cultures and mixed retinal cell cultures. PCR products for β-actin (296 bp), GLAST (287 bp), ABCR (355 bp), Ret (403 bp), and GFRα-1 (535 bp) of the correct and indicated sizes were obtained. Results are representative of three experiments.