![]() Figure 3 of
Yang, Mol Vis 2005;
11:641-647.
Figure 3 of
Yang, Mol Vis 2005;
11:641-647.
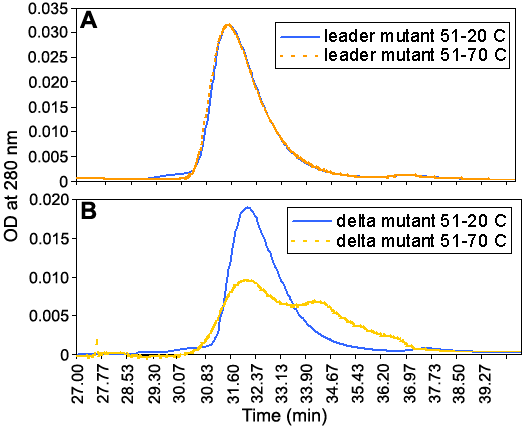
Figure 3. Mutant elution profiles after thermal stress
Each mutant underwent one cycle of heating to 70 °C followed by cooling to room temperature. The FPLC elution profiles for the two deletion mutants before and after heating are shown for comparison. A: Leader mutant 51 (LM51). B: Deletion mutant 51 (DM51). While LM51 exhibits little or no difference before and after treatment, the DM51 elution profile is altered into a series of different aggregate sizes.
