![]() Figure 7 of
Yamagami, Mol Vis 2005;
11:632-640.
Figure 7 of
Yamagami, Mol Vis 2005;
11:632-640.
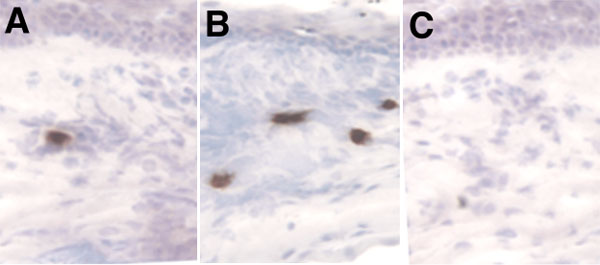
Figure 7. Enhanced presence of MIP-1α expressing cells in high-risk transplantation
These are representative micrographs of MIP-1α positive cells from high-risk grafts (HR; A), normal-risk grafts (NR; B), and HR grafts with isotype control antibody (C). There were significantly more MIP-1α positive infiltrating cells in the HR grafts than in the NR grafts.