![]() Figure 3 of
Scheef, Mol Vis 2005;
11:613-624.
Figure 3 of
Scheef, Mol Vis 2005;
11:613-624.
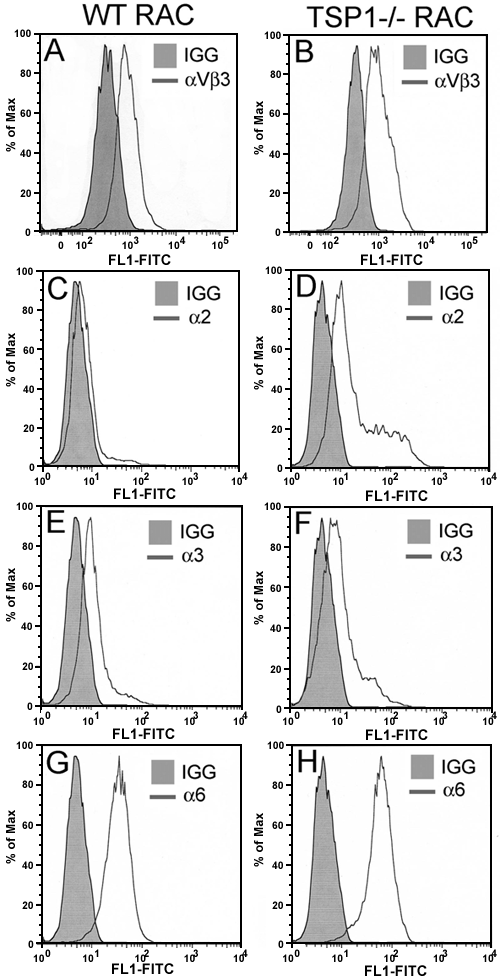
Figure 3. Expression of integrins in retinal astrocytes in cultures
Expression of αvβ3 (A,B), α2 (C,D), α3 (E,F), and α6 (G,H) integrins was determined using FACS analysis as described in Methods. The shaded graphs show staining in the absence of primary antibody (control IgG). Note similar expression of these integrins in wild-type and TSP1-/- RAC with the exception of α2 integrin. Each of these experiments was performed at least three times with similar results.
