![]() Figure 4 of
Zhao, Mol Vis 2005;
11:603-608.
Figure 4 of
Zhao, Mol Vis 2005;
11:603-608.
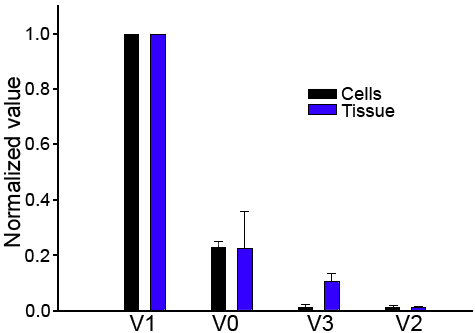
Figure 4. Versican mRNA forms in the human ciliary muscle
The amount of versican isoforms present in the cultured cells and in the tissue itself are plotted. In each analysis, the amount of the V1 form present in the cells or in the tissue was normalized to a value of 1. The analyses were run three times and the means of the values for the isoforms relative to the V1 form are plotted. The error bars on the bars represent the standard deviations for the difference between the value represented by that bar and 1 (the value for the V1 bar). The forms are plotted with the splice forms having higher values to the left.