![]() Figure 2 of
Cenedella, Mol Vis 2005;
11:594-602.
Figure 2 of
Cenedella, Mol Vis 2005;
11:594-602.
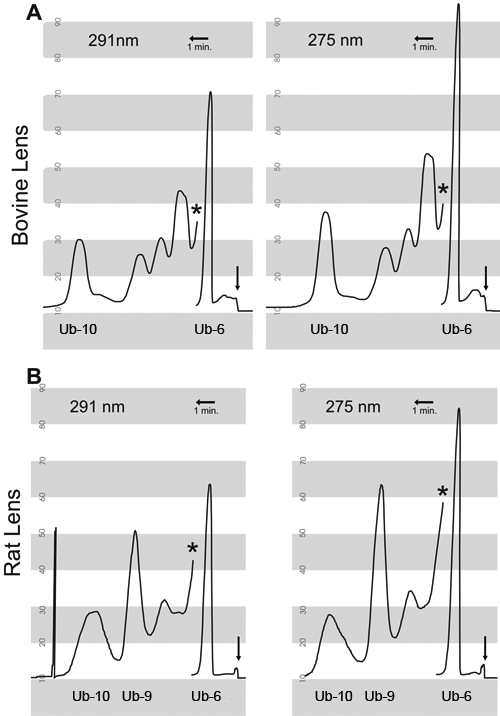
Figure 2. HPLC profile of lens ubiquinones examined at 275 nm and 291 nm
A: The separations at 275 and 291 nm each show bovine lens ubiquinones recovered from the equivalent of 1.2 g of a whole lens homogenate. Detector sensitivity was increased by twenty fold (asterisk) following elution of the internal standard (6.06 μg of Ub-6). B: The separations at 275 and 291 nm each show rat lens ubiquinones recovered from 48 mg of a whole lens homogenate. Detector sensitivity was increased by 62.5 fold (asterisk) following elution of the internal standard (4.545 μg of Ub-6). The concentration of Ub-10, estimated from the area under the curve, was corrected for the presence of a Ub-10-like impurity in the internal standard. Peaks eluting prior to Ub-9 (5.7 min) are unidentified. Vertical arrows mark the solvent front. Horizontal arrows mark one minute. Tracings are from right to left.