![]() Figure 1 of
Cenedella, Mol Vis 2005;
11:594-602.
Figure 1 of
Cenedella, Mol Vis 2005;
11:594-602.
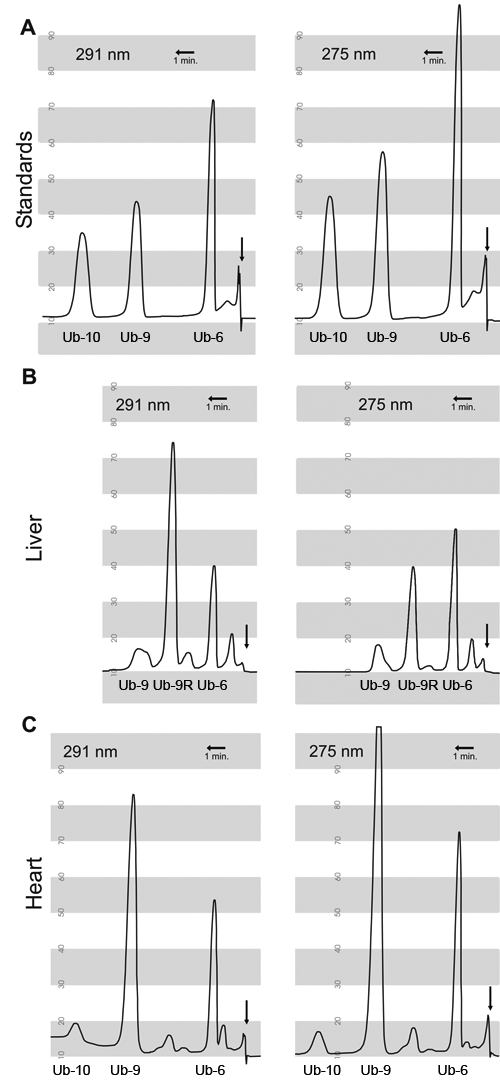
Figure 1. HPLC profile of ubiquinones examined at 275 nm and 291 nm
UV absorbance of oxidized ubiquinones are less at 291 nm compared with 275 nm. Reduced ubiquinones absorb more at 291 nm than 275 nm [26]. Peaks for ubiquinone-6 (Ub-6), ubiquinone-9 (Ub-9), reduced ubiquinone-9 (Ub-9R; ubiquinol-9), and ubiquinone-10 (Ub-10) are labeled. A: Absorbance of standards at 275 and 291 nm. B: Absorbance of rat liver ubiquinones at 275 and 291 nm. C: Absorbance of rat heart ubiquinones at 275 and 291 nm. Vertical arrows mark the solvent front. Horizontal arrows mark one minute. Tracings are from right to left.
